Tuning web server for more connections
Tuning web server for more connections
Recently, I was assigned a task, to figure out how to tune web server, so it can handle more connections at once. I know how to install web server, and I know how to set it up, but I actually haven’t thought about how to tune web server for more performance. This is a really good chance to get to know your web server better, so let’s dig in!
Disclaimer:
When you’re trying any parameter to your service/application, it’s important for you to know what that parameter means. Any tuning is useless unless you know how that parameter changed your service/application. Do this on your own risk, and only change one parameter at a time. Check if a change makes your service/application unstable, if it did, rollback, proceed to next change if everything works fine.
The task I was assigned is to improve performance for Amazon EC2 instance, running Amazon Linux 2. But any Linux distro should works fine, too.
The results in this post came from Ubuntu Server 20.04.
Kernel Options
Unless specified, these options are going to be written in /etc/sysctl.conf
Virtual Memory
Every program in the system have it’s own virtual memory, and it’s operating system’s job to manage those memory.
We have four parameters to study here.
1 | vm.swappiness |
Let’s take a look at each of these parameters
vm.swappiness
This represents the percentage of the free memory before activating swap. The lower the value, the less swapping is used and more memory pages are kept in physical memory.
The default value of vm.swappiness is usually 60, and using swap may make your program less responsive, so if you need your program to be responsive at any time, it’s better to lower the value of this parameter.
For MariaDB, it’s recommended to set vm.swappiness value to 1. For web server, setting this value to 10 should work.
vm.dirty_ratio
For vm.dirty_ratio, we need to talk about what dirty means first.
dirty memory means the memory data that is in the physical memory, and needed to be written into the disk. Because hard drive’s write speed is usually slower than RAM’s write speed, and there are lots of write tasks in the system, so it’s understandable that system would first write data into RAM temporarilly, then, when there’s too many data in memory or system is idle, it would write those data into hard drive, and release those resources.
When your program creates too many dirty memory, it may make other programs unable to get memory, thus result in lower system performance, so it’s a good idea to write dirty memory into drive before it consume too many RAM.
vm.dirty_background_ratio
The difference between vm.dirty_ratio and vm.dirty_background_ratio is, vm.dirty_ratio will run writeback in foreground, and vm.dirty_background_ratio will run in background.
So the value of vm.dirty_background_ratio should always be lower than vm.dirty_ratio.
An example of these values is
1 | vm.dirty_ratio = 75 |
You need to consider your machine’s spec for these values. Whether you got lots of RAM or you got RAID card, they will make lots of difference when applying these values.
vm.vfs_cache_pressure
This percentage value controls the tendency of the kernel to reclaim the memory being used for caching of directory and inode objects.
If your program is going to open lots of file, or accessing lots of directory, it’s a good idea to set this value lower, set this value higher otherwise.
The default value of this option is 100, set this value higher means more aggressive, set this value lower means unaggressive.
Network
BBR
BBR is a TCP congestion control algorithm developed by Google, this will not speed up your network.
For more detailed information about BBR, please refer TCP BBR congestion control comes to GCP - your Internet just got faster.
In short, BBR can bring higher throughput and lower latency to your system, it uses recent measurements of the network’s delivery rate and round-trip time to build an model, that can be used to control how fast it sends data and the maximum amount of data it’s willing to allow in the network at any time.
BBR’s code is merged into Linux kernel since version 4.9, recent Linux distro should have tcp_bbr kernel module.
Use command below to enable BBR in your system.
1 | # modprobe tcp_bbr |
Connection, socket buffer and other tunables
We are going to talk about these parameters
1 | net.core.somaxconn |
net.core.somaxconn
This option will set the maximum value of total connections to kernel. This effect your web server’s performance a lot.
The default value of this option is 128, and this value has been raised in kernel 5.4 to 4096.
net.core.rmem
If you type sysctl net.core.tcp_rmem, you should see three numbers, like this
1 | tsundere@ubuntu-server:~$ sysctl net.ipv4.tcp_rmem |
The first number is the minimum TCP buffer size, the second number is current TCP buffer size, the last number is maximum TCP buffer size.
Why do you need a bigger buffer? There are two kinds of senario, one is you got really fast network environment, and second one is you’re communicating over high-latency WAN. Both senarios can benefit from a larger TCP buffer size.
First, let’s refresh our memory with TCP three-way handshake.
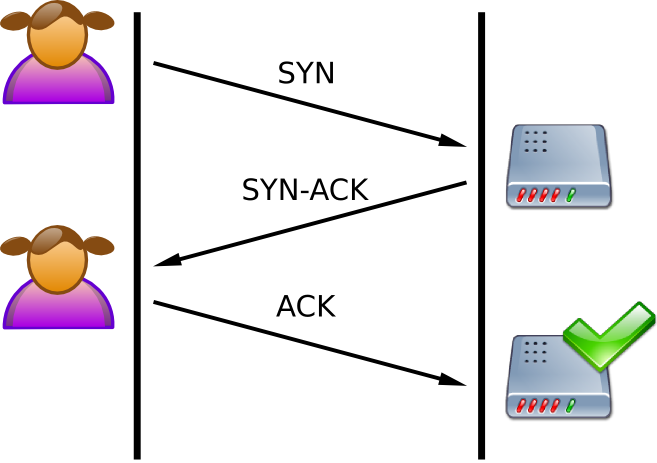
In order to ensure that client got the packet that server sent, the server really can’t send any new packet to the client, thus less efficient network. By increasing buffer size, you can send larger packet at once, thus increasing efficiency in your system.
For this option, you need to calculate the value for your system yourself. The value should be your network speed in bytes times your round-trip delay time in seconds. For example, for a 1Gbps network with 4ms delay, the maximum value of net.core.rmem should be 500kbytes, or 512000. Setting maximum buffer too big will just result in network congestion.
net.core.wmem
Refer to net.core.rmem
net.core.optmem_max
This option affects the memory allocated to cmsg list maintained by the kernel that contains “extra” packet information like SCM_RIGHTS or IP_TTL.
Increasing this option allows the kernel to allocate more memory as needed for more control messages that need to be sent for each socket connected (including IPC sockets/pipes)
The content above is copied from In Linux, how do I determine optimal value of optmem_max?, nice answer.
net.ipv4.tcp_fastopen
Yeah…we need to talk about TCP three-way handshake, again.
For a normal TCP three-way handshake, the data can only be sent after the client send “ACK” to server, then server can send data back to client. This is not efficient, is there any way that we can send data earlier?
TCP Fast Open solved this issue. When the client created a connection to the server for the first time, the server would issue a cookie, and send to client when server send “SYN-ACK” back to client, and now the client have the cookie.
Now, when the client create another connection to the server, it would also send the cookie to the server, the server can identify the client using that cookie, and it would know that this client has created connection before, so now I can send data directly to the client. So instead of sending “SYN-ACK”, the server would send “SYN-ACK + Data”, so the client won’t need to send “ACK” again.
The options for net.ipv4.tcp_fastopen are
0, disabled
1, only enabled on outgoing connections
2, only available on listening sockets
3, enables on outgoing and listening
net.ipv4.tcp_tw_reuse
This will enable reuse of TIME-WAIT sockets for new connections when it’s safe from protocol viewpoint.
Basically, this means the server can use the socket that was already created, have been used and now is idle. By reusing the connection, the system will not need to create a new socket, resulting in faster connection creation time.
The value of this option is
0, disable
1, global enable
2, enable for loopback traffic only
net.ipv4.tcp_max_syn_backlog
This option will tell kernel how many half-open connections can keep in connection queue. If you have lots of clients connecting to server, and server can’t handle connections fast enough, put those connections to queue instead of refusing connection is a good idea.
net.ipv4.tcp_window_scaling
This option allows kernel to change TCP window size. If this option is enabled, program can increase the size of their socket buffers and the window scaling option will be employed.
This option has two available value
0, disabled
1, enabled
File Descriptor
This will affect the maximum number of files your system/user/program can open at once.
Kernel Option
fs.file-max
This option will control the maximum amount of files that your system can open at the same time.
Bigger is usually better.
/etc/security/limits.conf
This file is used by pam_limits, and it can limit how many resources a user can get.
There are two kinds of limit, soft and hard. You can think soft as default value, and hard as upper limit.
If I want to change how many files user nginx can open at the same time, I need to write these lines into /etc/security/limits.conf
1 | nginx soft nofile 1048576 |
Systemd Limit
Systemd will also limit how many files a service can open at the same time.
To change the maximum number of files a service can open, add LimitNOFILE=<AMOUNT> option into [Service] block in the unit file.
RAM & swap
If you have enough RAM, but your system is still using swap, other than changing the value of vm.swappiness, you can also use zram to create swap.
Zram
Zram basically is swap in RAM. It can create swap using RAM, and it also support compression, creating a much faster and efficient swap.
Commands below are example for creating zram
1 | # modprobe zram |
Web Server
For my task, I was asked to tune Apache Web Server and Nginx.
And these are options I found helpful when tuning for performance.
Apache
options
ServerLimit
This option will set the the maximum number of child process that Apache can have.
MaxRequestWorkers
This option will set the maximum number of thread a child process can handle at the same time.
npm_event_module
The npm_event_module was created at time around Apache 2.0, this module is designed to allow more requests to be serrved simultaneously by passing off some processing work to the listening threads, freeing up the worker threads to serve new requests.
There are some options for this module.
StartServers
Number of child processes created at startup.
MinSpareThreads
Minimum number of idle threads available to handle request spikes.
MaxSpareThreads
Maximum number of idle threads available to handle request spikes.
MaxRequestWorkers
Maximum number of connections that will be processed simultaneously.
MaxConnectionsPerChild
Limit on the number of connections that an individual child server will handle during its life.
Nginx
http block
worker_rlimit_nofile
This option will set the maximum amount of files a nginx worker can open. Don’t set this any larger than system limit.
worker_connections
The maximum amount of connections a worker can handle at once.
gzip
This option can enable gzip compression for HTTP request.
open_file_cache
This option can enable caching for file descriptors, very helpful when serving static files.
server block
listen
fastopen
This option will tell nginx to use TCP Fast Open for conection, remember to enable kernel support for TCP Fast Open.
backlog
This option will limit the maximum length for the queue of pending connections. You can set this option the same value as net.core.somaxconn
reuseport
This option will tell nginx to create individual listening socket for each worker process. This will allow kernel distributing incoming connection between worker processes.
Results
We have seen lots of tunables, and now it’s time to see the numbers!
Testing VMs are using Ubuntu Server 20.04
Both server and client are equipped with 2 vCPU, 2GB RAM
Test was done using hey
Before
Let’s start by testing our web servers with 1500 clients, and creating 15,000 requests.
Nginx
1 | $ hey -c 1500 -n 15000 http://192.168.133.142:8080 |
We got some errors with Nginx, hope there isn’t going to be any error after tuning.
Apache
Using the same testing params as Nginx.
1 | tsundere@stress-test:~$ hey -c 1500 -n 15000 http://192.168.133.142:8081 |
Although Apache takes more time, but it completes all the requests, good job!
After
I changed the params to 9000 clients, and total requests of 90000. 6x the amount of before, let’s see the result.
Nginx
1 | $ hey -c 9000 -n 90000 http://192.168.133.142:8080 |
Apache
While trying with 9000 clients and 90000 requests, Apache failed lots of requests. So I decreased the clients to 6000 and 60000 requests.
1 | $ hey -c 6000 -n 60000 http://192.168.133.142:8081 |
Conclusion
I think there’s still more options/parameters to tune, and log from web servers should be helpful when we want to increase the connections to the server. But after some simple tweaks, the web server can perform 4x to 6x better than before, I think it’s worth the tuning and studying.